The Flow Server is where your information gets visualized. It is a web server that serves the web portal for reporting and manual data capture.
The Flow Server is also responsible for generating the chart and dashboard attachments for the Messaging System.
It plays a central role in the Templating System as well as in Flow Tiering.
Due to the Flow Server playing such a central role in these sub-systems, it is imperative that all these systems are able to access the Flow Server, which may require firewall settings to be adjusted.
All interaction with the Flow Server (other than the configuration thereof) is through a web browser. By default, if no changes are made to themes and colors, the Flow Server landing page looks like the following image

In the top left of the screen you can see your company's logo (by default, the Flow logo is used) as well as the name of this Flow Instance (this name may be changed in System Properties). Clicking on the
Your company's logo is also displayed in the center of the landing page.
These icons may be customized as required. See What settings can I configure for my Flow Server? Can I change Colors to match my Corporate Identity?
In the top right of the screen, you'll see the User Profile icon - if you see an icon that resembles a person, then you are not logged into the Flow Server.
User Interface
When opening a chart/dashboard in the Flow Server in a browser, you are presented with an image similar to the following:
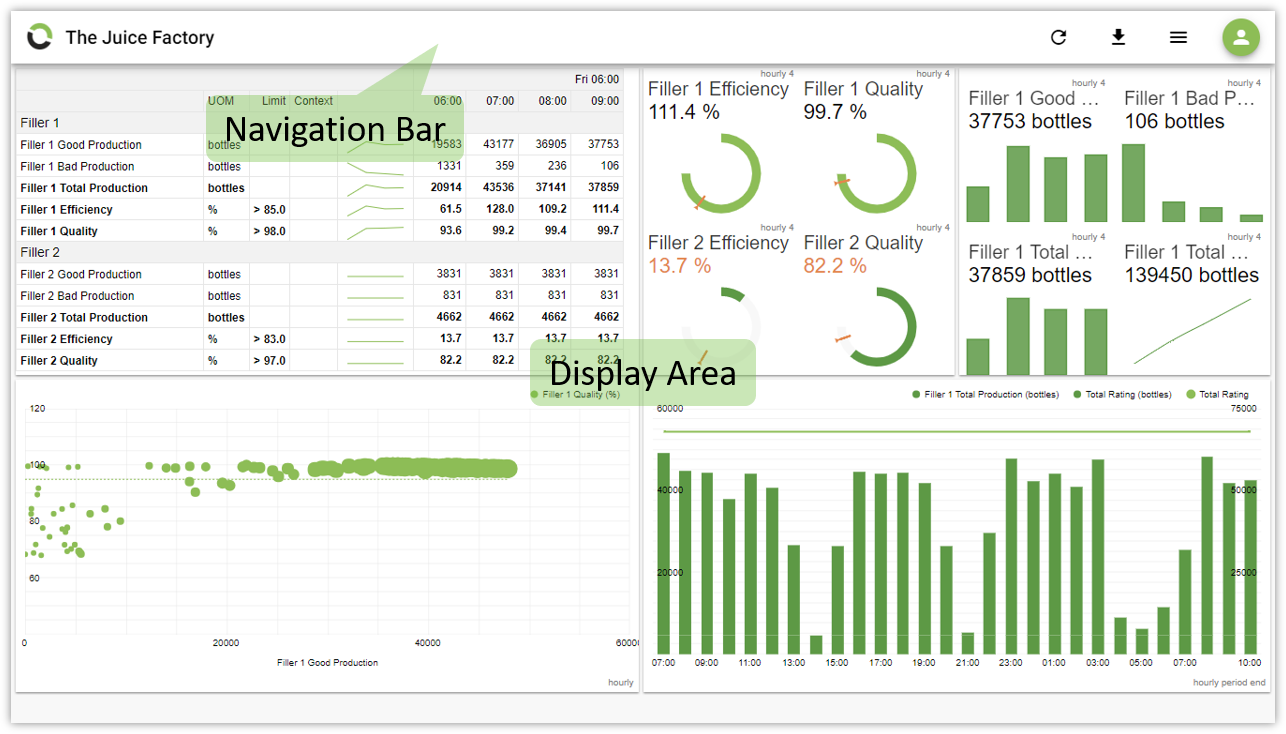
The major components of the user interface are the Navigation Bar and the Display Area.
The Navigation Bar is used to navigate within the Flow Server and for any actions or options that need to be applied to the Display Area.
The Display Area is where the content is displayed such as Charts, Dashboards and Forms.
Navigation Bar

The Navigation Bar consists of the following components:
|
The Icon that is configured in the Flow Server Theme. |
|
The Flow Instance name. |
|
Refreshes any data being displayed. |
|
Exports the contents of the Display Area to the selected format. |
|
Shows a side bar with options to manipulate the displayed information in the Display Area. |
|
This is used to either display the sign in page if not signed in, or the user profile page if signed in and the sign out option. |
Opening the "Index" Menu
The Index Menu is displayed by clicking on either the Icon or the Flow Instance name in the top left of your browser window. The Index is used to navigate the Report and Form trees, which have been configured using the Flow Config tool.
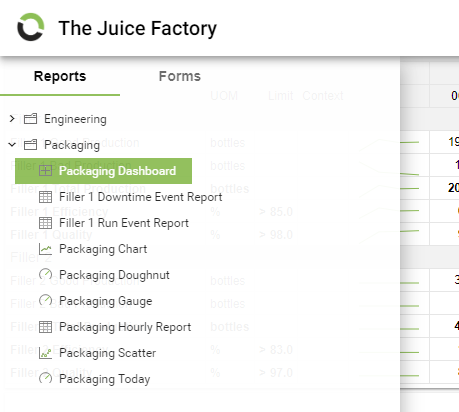
When clicking on a Report or Form in the Index Menu, the Display Area will update and display the respective report or form. To close the Index, click anywhere in the Display area, or click on either the Icon or the Flow Instance name.
If you cannot see a Report or Form that you expect to be seeing, it could be that you have not been granted access to it. Speak to your Flow Administrator regarding this.
For more information on configuring the actual charts and forms that the Flow Server renders, see the relevant articles on configuring these, such as: