When configuring measures in Flow, it is often desirable to see the raw data in your data source item, and even to compare how the contextualized information in a Flow Measure Value relates to the raw data.
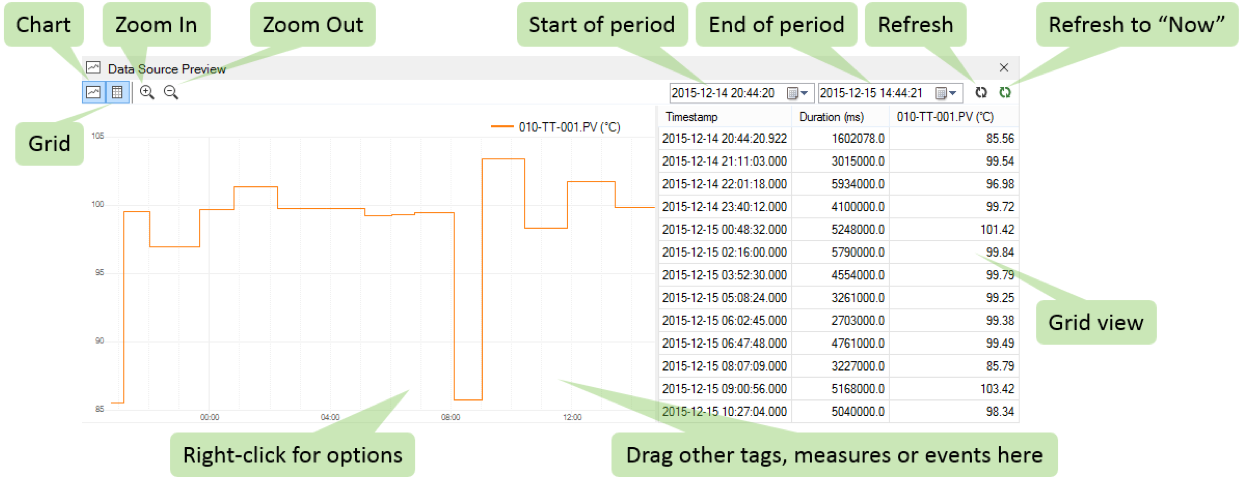
To help you with this, Flow has a built-in Data Source Preview. To launch the Data Source Preview, double-click on any item in your data source's namespace.
Not all data sources are capable of providing the raw data for visualization. For example, the Historian data sources will generate a raw data preview, but a transactional data source such a a database server cannot provide raw data for visualisation, because a query needs to be written to query the raw data. In such cases, it would be best to use the visualization tool that the data source provides, or use the relevant IDE (Integrated Development Environment) to query the raw data.