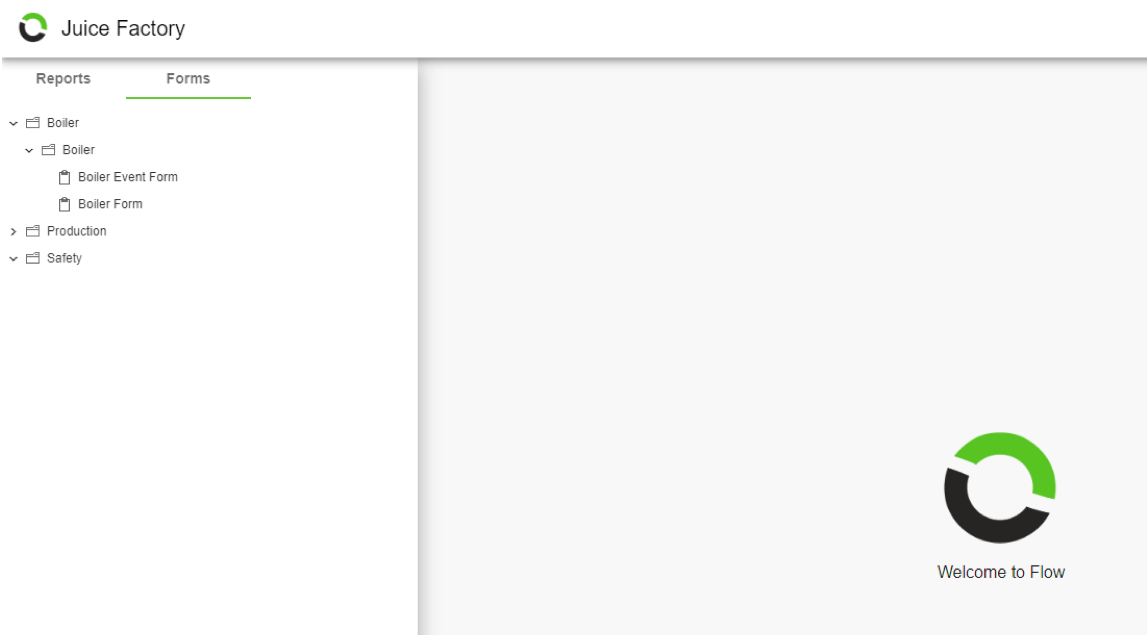
Forms can be accessed from the Flow web front end by selecting the index icon to expand the menu tree on the left hand side.
By default, the index icon is the Flow logo. This may be changed in your Flow Server settings.
The menu tree is divided into two sections: Reports and Forms.
Selecting the “Forms” section will generate a menu structure mirroring the menu structure you created in the Forms tab of the Flow configuration tool.
Selecting one of the form icons will open the Form in the browser window, ready for data capture.
The Form will be populated with the measures that were configured in the Form editor.
Remember that measures of multiple interval types may be added to the same form. When the form is opened in the browser, the form will default to displaying the measures with the smallest interval type. You can display measures of other interval types by using the drop-down menu in the Settings panel.
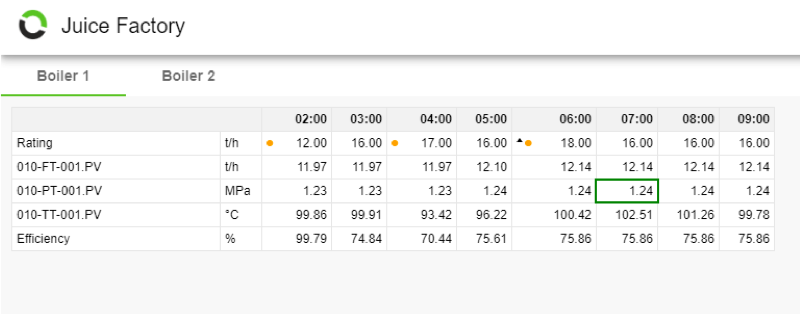
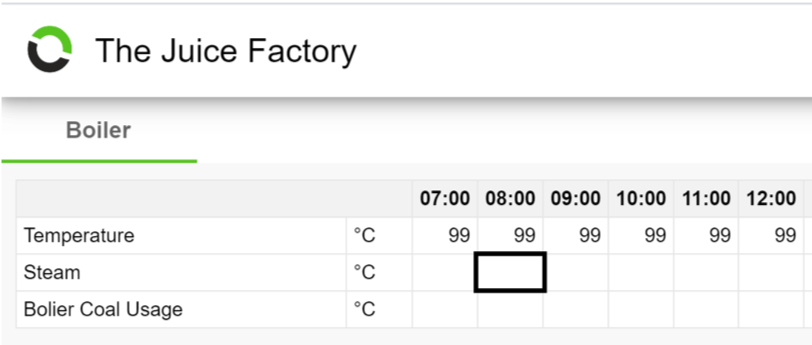
To add or modify data, select one of the cells that needs to be changed. The border of the cell will change to a dark green color. This indicates that one can edit the data.
If the border around the cell changes to black, it means that the data cannot be edited. This would be true for calculated, aggregated, and replicated measures, as their data cannot be changed - only the source measures used in the calculated, aggregated, or replicated measure can be edited.
It is also possible that the selected measure has a different calendar context from the one that you are currently viewing (as set in the Settings Panel). To edit such a measure, expand the Settings Panel, and change the calendar selection.
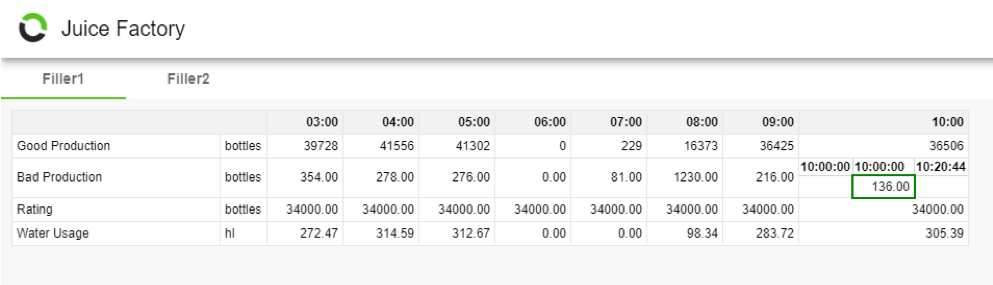
In some cases, a cell might be highlighted dark green, but you still cannot change the value in the cell. This might be a measure that has been sliced by an event and has event context.
If this is the case, it means that one cannot edit the value in the cell directly, but one has to edit the individual time slice values, because these are combined to compute the value in the cell.
To edit the time slices, select the “F2” key on the keyboard to expand the cell to show the time slices that made up the time period selected.
It is now possible to change one or more time slice values, which will then be aggregated to a value for the time period.
Changing a value and selecting another cell will commit the new value. One can also use the “Enter” and “Tab” keyboard commands to commit values.
“Enter” will commit the value and move the selection to the cell below, while “Tab” will commit the value and move the selection to the cell on the right.
Double-clicking on a cell will bring up the "details" sheet from the bottom of the browser window.
The details sheet allows users to add comments and see the version history of the selected data point.
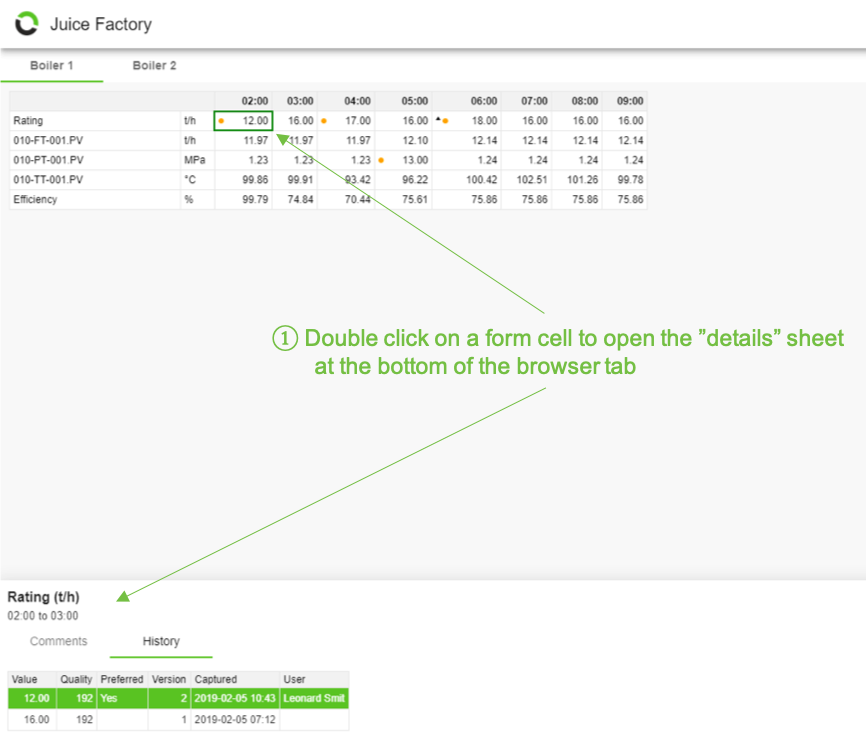
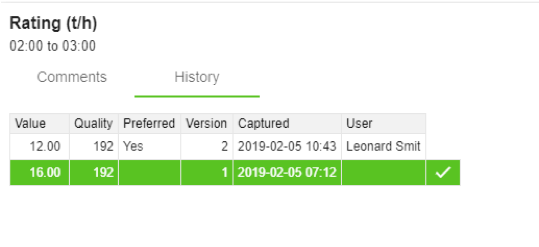
One can also revert to a previously entered value by selecting the tick mark next to the desired version of a data point:
Form Settings Panel
Certain aspects of the Form can be changed by accessing the Settings Panel. The button with the 3 horizontal bars in the top right corner is used to expand and collapse the Settings Panel. For Time Period Forms, it is possible to change the following properties:

|
Select the start time for the date range data needs to be captured for. |
|
Select the end time for the date range data needs to be captured for. |
|
If measure on the form has context to different or more than one calendar, the different calendars will be available for selection in the dropdown. |
|
The different interval types of the different measures added to the form will be listed in the dropdown. Only the interval types relevant (based on the measures added) will be available for selection (measure specific). |
Note: A default time range cannot be configured for forms; the time period with which a form opens by default is based on the Interval Type and Period Start Intervals configured in the Form Editor.